News
India’s spectrum auctions can seem very confusing. Here is an overview of how to collect the auction data for the spectrum database.
- Wait for the “Demand Note in respect of successful bidders” to be released on the Department of Telecommunications (DoT) website. This can usually be found under the auction page for the auction you are entering into the database here.
- The “Demand Note” is a letter sent to operators and auction winners detailing how much money they owe the government for their purchased spectrum. It’s the best place to collect data because it mentions the final price for each band and the size of the spectrum blocks. It does not mention the exact frequency range of each license, however, this varies based on region and is therefore not something we usually collect as it would require us to enter every single license.
- The demand note will go through each bidder and their purchased spectrum licenses in each band.
- Spectrum is sold by region which includes Indian States (such as Andhra Pradesh and Assam) as well as metro areas such as Mumbai, or even disputed areas such as Jammu & Kashmir.
- Open this google sheet which details the size of each of these areas and what this equates to as a percentage of the total population (you should have access if you have access to the spectrum database folder on google drive).
- Begin entering license data into the database. If a bidder has won a license in only one or two regions, it is possible to enter these individually as separate entries.
- However, if a bidder has purchased licenses in 12 out of the 22 regions, for instance, it is easier to combine these into one entry.
- When combining, calculate the average size of a spectrum block spectrum. You can use the “average calculator” on the Google sheet to do so (NOTE: If the “demand note” says an operator has won 10 MHz and that particular license is paired, this equals 2 x 10 MHz).
- After combining the average bandwidth size, you will need to calculate how much of the Indian population is covered by these combined licenses. To do this use the “license pop size” tool in the Google sheet. Use the drop-down menu to enter all the regions that an operator has a license in and you will see the sum of the pop covered at the bottom.
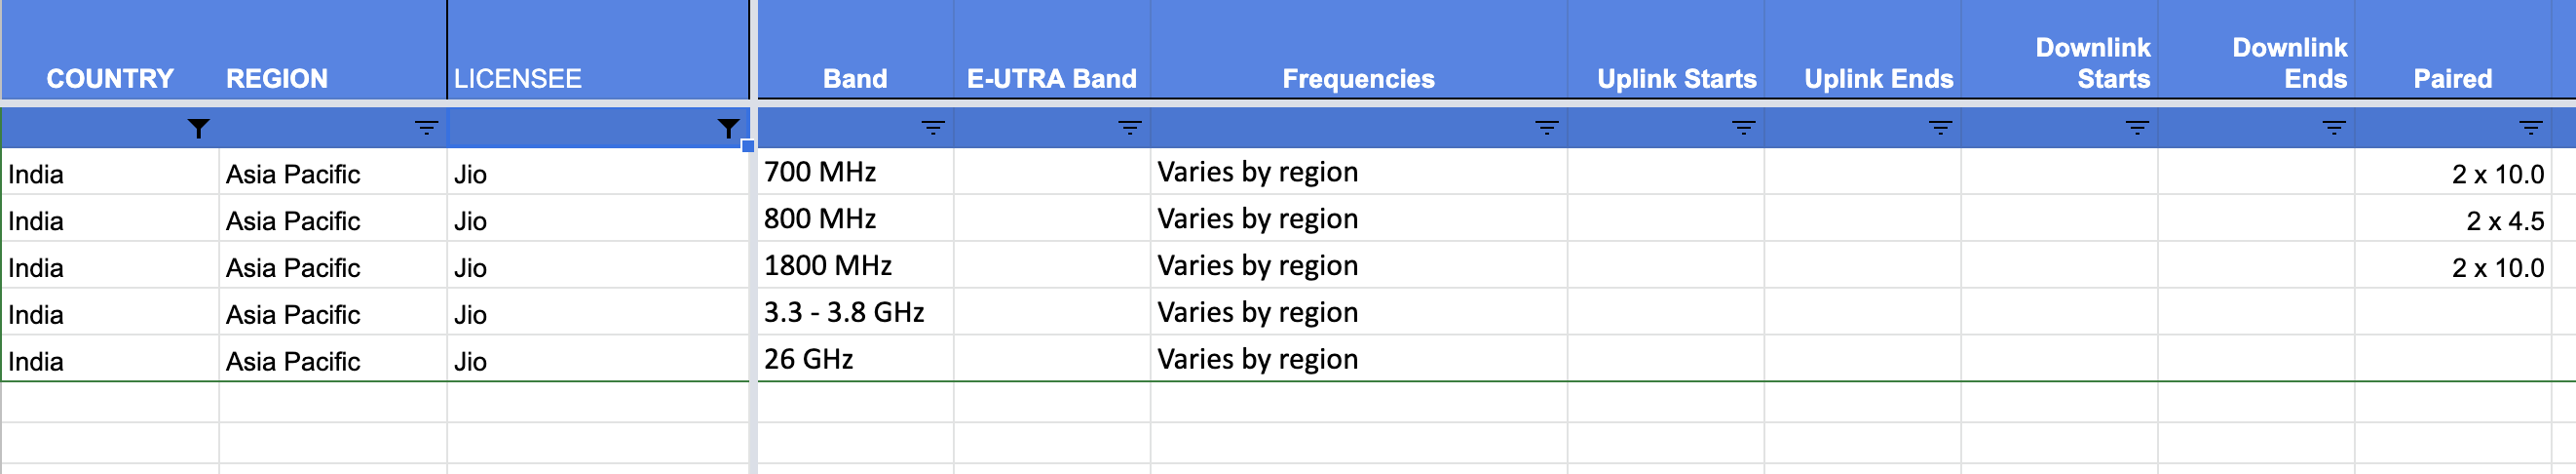
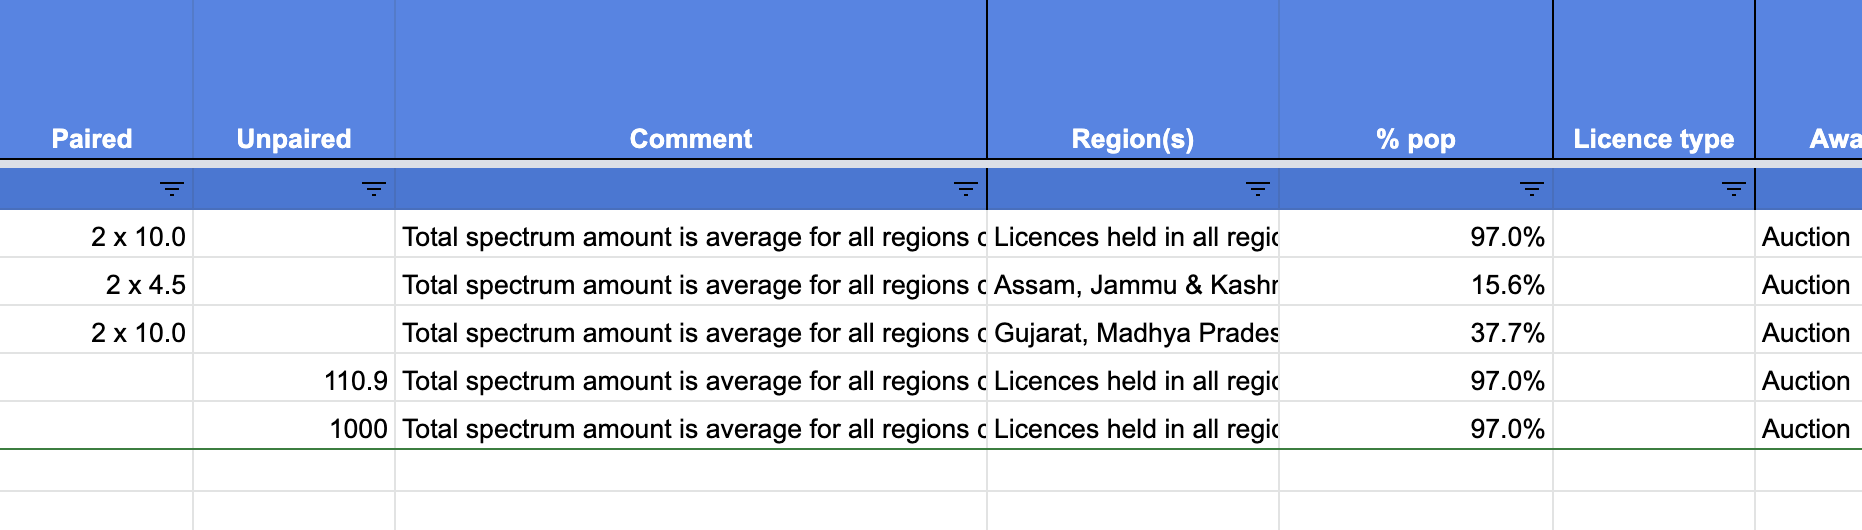
- Below is an example of entries for Jio’s licenses purchased in the 2022 multi-band auction. Entering an exact frequency is not required. If there are only a few regions covered, it is fine to list them all in the “Regions” column. Otherwise, write “16 regions including …” and name a few regions covered.