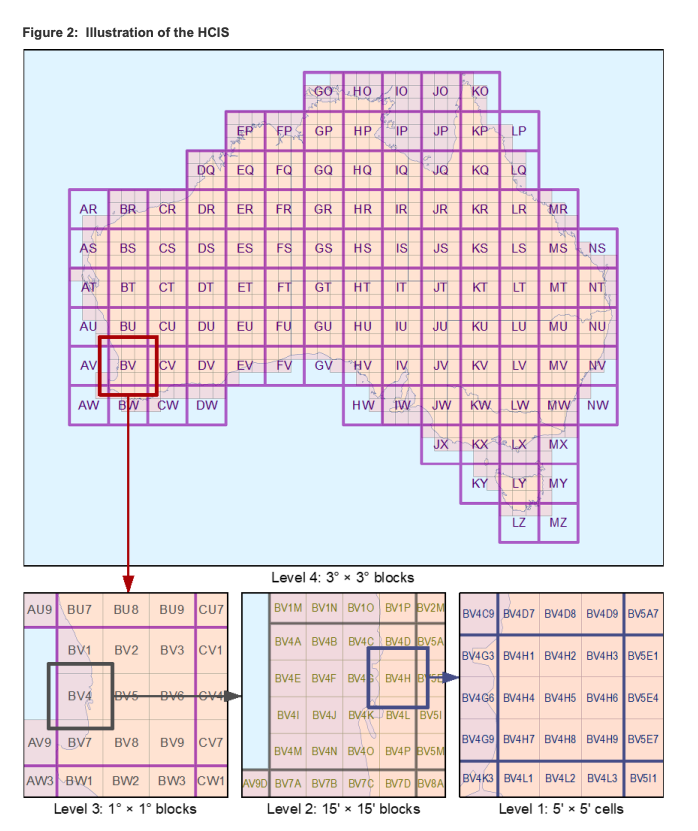
Australia’s spectrum auctions are held on a regional level. The country is divided into different parts. The Australian spectrum map grid is used for this, which sets out the size of different “cells”. The details of which cells make up individual licences will be set out in the documents for each auction that you are looking to collect data on. In the case of the 3.4 and 3.7 GHz auction of 2023, this document is called the ‘marketing plan’.

Calculating how many people live in a selection of “cells” is very difficult without advanced population mapping software. Instead of doing this, we rely on outside sources which have already calculated regional populations. This is particularly easy when calculating the population size of city-wide licences such as Sydney or Brisbane. Other times, licences cover the “rural population” of a particular state. The Australian Bureau of Statistics maintains this data (example here of rural Victoria population).
To simplify this process, we only include licences that cover more than 5% of Australia’s population. See this Google sheet that breaks down how we collected the 3.4 GHz and 3.7 GHz licences awarded in late 2023. Note that these are all estimates, and if you are unsure of a population size, do not include the licence. Inaccurate data on population percentage can skew MHz/Pop calculations on the database.