Blog
New feature: compare spectrum markets around the world
A new module for the Data Explorer graphically contrasts frequency assets in national mobile markets, shows the number of operators and reveals how evenly spectrum is distributed.
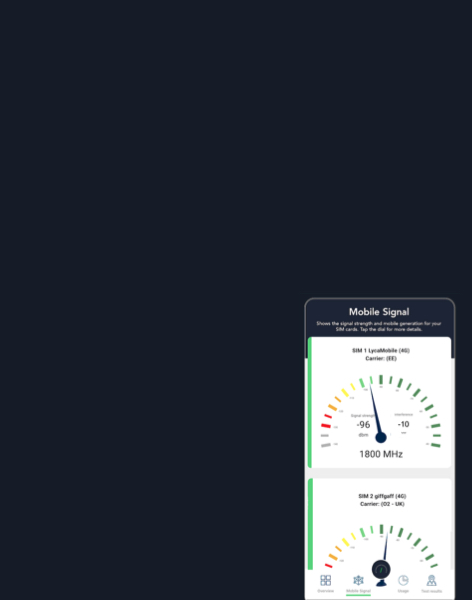
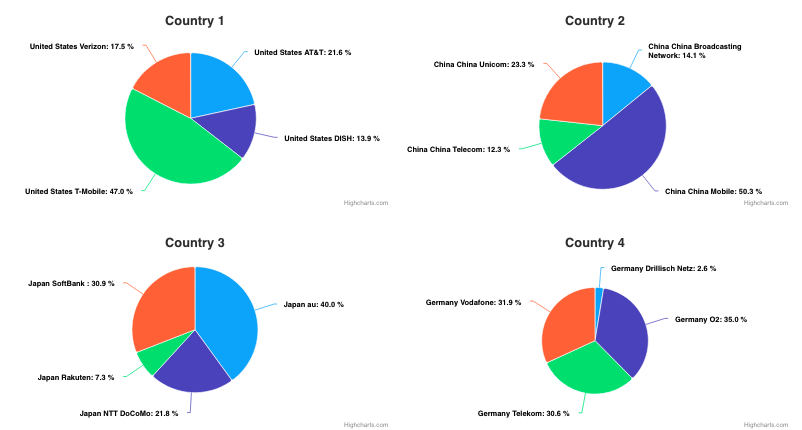
The new module has two views. It can zoom in on selected countries, showing operators’ mobile spectrum holdings in low, mid and high bands, displayed as pie charts and graphs.
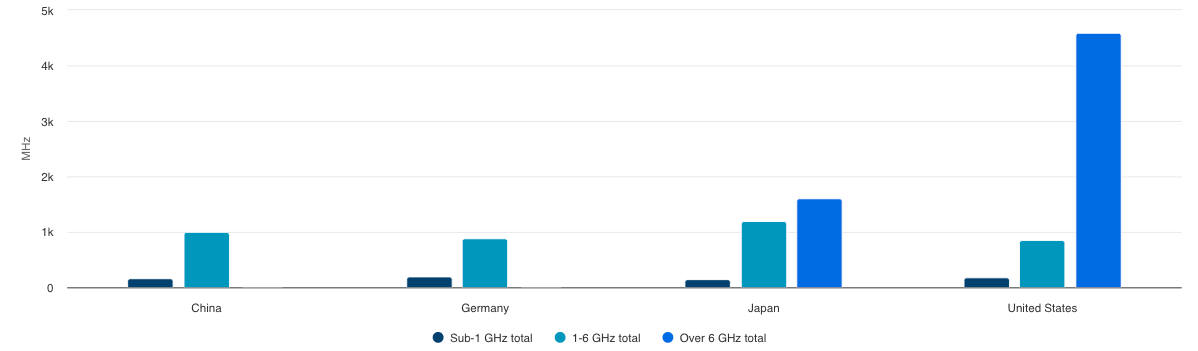
The second view compares national spectrum markets – showing the amount of mobile spectrum assigned, the number of MNOs, and how evenly the spectrum is distributed.
Any country can be selected for a detailed comparison of MNO holdings, or the data can be filtered for benchmarking.
Full details of the sourcing and methodology used is available here and this page explains the questions the Data Explorer can answer.
By |
PolicyTracker
Experts talk spectrum.
Listen Now
Spectrum Research Service
- Dossiers new
- Benchmarking new
- Spectrum database
-
Research notes